LLM Observability and Production Monitoring: From Traces to Reliability
Introduction
An LLM application may perform well during development but behave differently when exposed to real users.
Production environments introduce unpredictable queries, changing usage patterns, external API failures, retrieval errors and unexpected model responses.
Traditional application monitoring is not sufficient to understand every failure in an LLM-powered system.
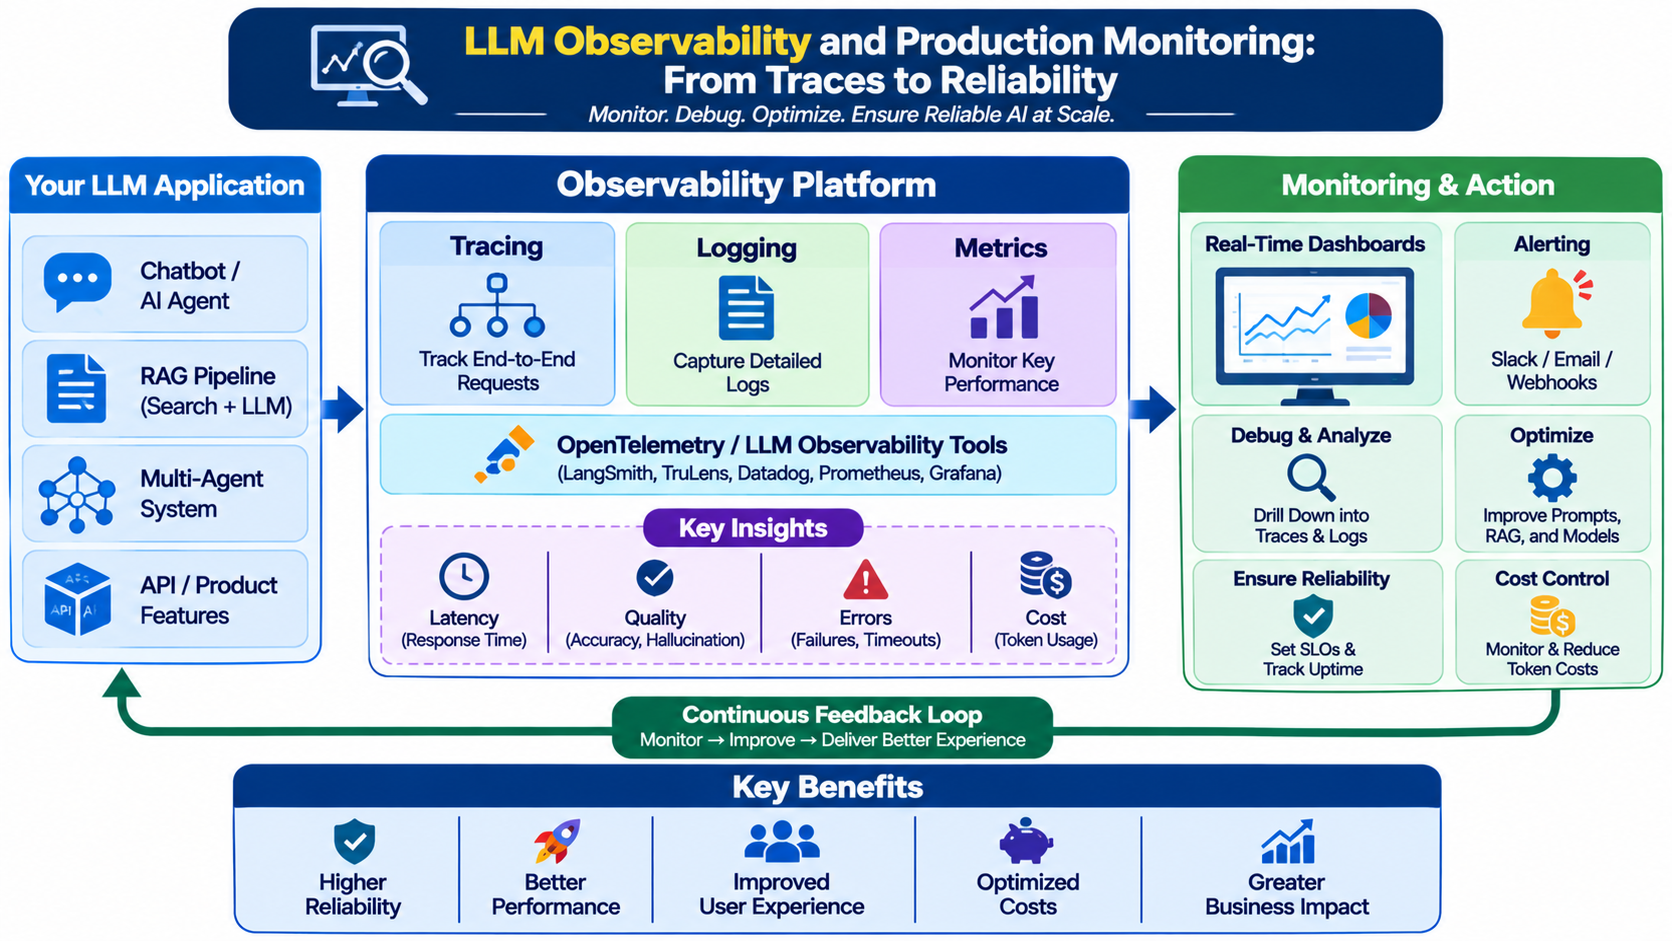
LLM observability provides visibility into the internal behavior of AI applications.
What Should You Monitor?
1. Latency
Measure how long the application takes to generate a response.
Track total response time and individual stages, such as retrieval, reranking, model inference and tool execution.
2. Token Consumption
Monitor input and output tokens to understand model usage and identify unusually expensive workflows.
3. Cost
Track estimated or billed model costs per request, user, workflow and business function.
4. Retrieval Quality
Monitor retrieved document relevance, missing context and retrieval failures.
5. Tool Execution
Track which tools agents invoke, whether those calls succeed and how long they take.
6. Response Quality
Use automated evaluators and human feedback to identify incorrect, irrelevant or unsupported answers.
Understanding Tracing
A trace records the execution of an application workflow.
A RAG trace might contain:
User input
Query transformation
Embedding generation
Retrieved documents
Reranking results
Model input
Model output
Total execution time
For agentic systems, traces can also capture agent decisions, tool calls and state transitions.
This helps developers identify exactly where a workflow failed.
Monitoring Tools
Tools such as LangSmith support tracing, evaluation and monitoring of LLM and agent applications.
OpenTelemetry can also provide standardized telemetry across distributed services.
These capabilities can be integrated into a broader production monitoring architecture.
Designing a Monitoring Dashboard
A practical dashboard should track:
MetricPurposeAverage latencyResponse performanceP95 latencySlow-request detectionToken usageModel consumptionCost per requestFinancial efficiencyRetrieval successKnowledge access qualityTool failure rateAgent execution reliabilityFaithfulnessGrounded response qualityTask completionWorkflow effectivenessAlerting and Incident Management
Monitoring becomes valuable when it leads to action.
For example, an alert can be triggered when:
API failure rates increase.
Response latency exceeds a defined threshold.
Token consumption suddenly rises.
Retrieval quality drops.
Tool execution repeatedly fails.
Thresholds should be based on workload-specific baselines rather than arbitrary universal values.
Conclusion
Production AI requires more than a working model endpoint.
Observability enables teams to understand application behavior, identify failures, control costs and improve quality continuously.